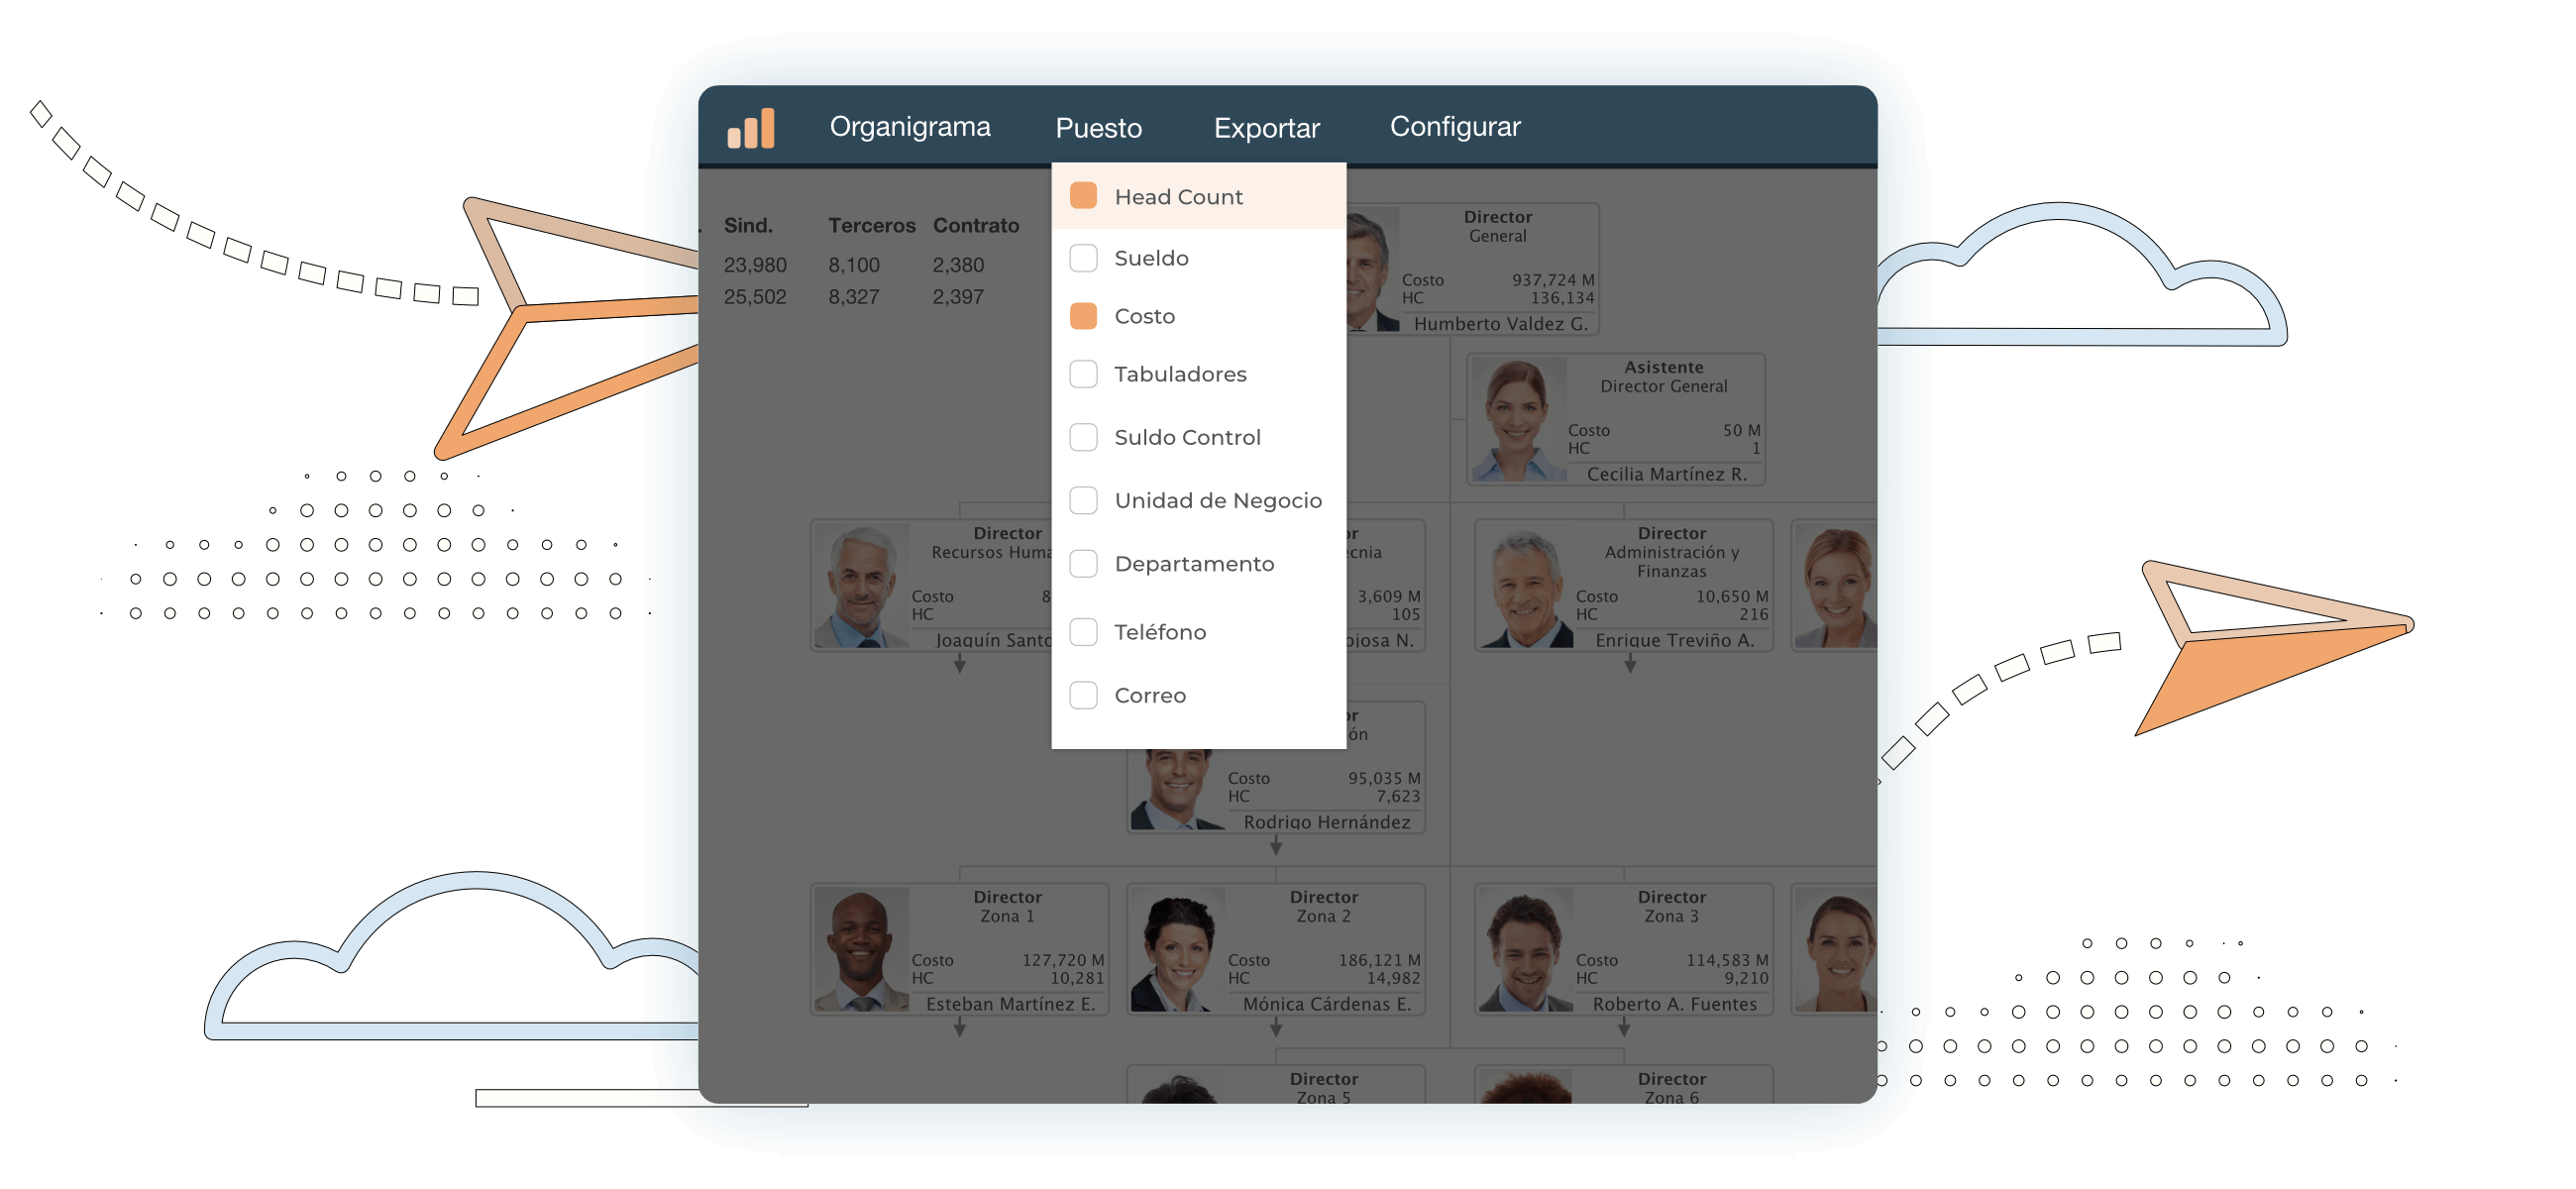
Human Capital is the most important resource an organization has to reach its goals and objectives, and when it is not correctly managed, the whole organization suffers in a lack of efficiency and an increase in costs.
As companies grow, the organizational structure becomes more complex and more difficult to visualize, making the job of decision makers much more harder.
An Organizational Chart offers an excellent solution to this problem, with three main characteristics:
1. A clear image of the organizational structure.
In startups or small businesses, normally a single employee will have many responsibilities of different areas of the company. There are rarely many clear boss-subordinate relationships. Sure, everyone knows who is the boss, in most cases the owner or founder, but most employees will work in an environment where almost everyone share very similar responsibilities.
If we had an organizational chart at this stage, it would show a very flat organization.
But when a business grows, responsibilities also grow. In consequence, more clear roles need to be defined within the organization. And an organizational chart becomes an excellent tool to let all employees know their role and responsibilities, and to define a chain of command within the organization.
2. Faster decision making.
How often we need to delay meetings because the information is not readily available? Or how many work hours are wasted in making manual organizational chart drawings instead of using this time for more productive tasks?
With an organizational chart, you have easy access to the most important data and documents of your organization, all of them ordered in a visual and logical way, instead of endless lists of names.
3. Simple and intuitive.
There is a quote that says "a picture is worth a thousand words", and it couldn't be more true with the Organizational Chart. Seeing the whole structure of your company gives so much information about its current state, all this in a simple and intuitive way.
Everyone knows how Organizational Charts work, they are easy to understand. And when things are easy, simple and intuitive, people will keep using them.

